Release notes *2.8.1*
Thu 7 Aug 2025 16:23:43
Automated export to interactive HTML
We got rid of a hassle, that you needed to do in order to export notebooks with interactive elements. At least for the build-in functions such as:
ManipulateManipulatePlotManipulateParametericPlotAnimate
this is a single click - Automatic

Here Manual sampling is the same, as Dynamic HTML option was before.
Try it out!
Manipulate[Plot3D[Sin[x w]Cos[y w], {y,0,2Pi}, {x,0,2Pi}, PlotRange->Full, ColorFunction->"Rainbow"], {w,0.1,2,0.1}, ContinuousAction->True] Manipulate and Animate
We improved our JIT transpiler. But it might still not like too many changes.
Try to keep the number of curves/traces the same as well as polygons if possible to get the most from JIT. Try not to add new entities as well.
PerformanceGoal->"Speed" is also a good option for 3D plots.
Mesh->None might also help.
PlotRange->Full can help to avoid fragmentation of line segments
Here is some more examples:
Manipulate[
 Plot[Evaluate[
   y[t] /. First[
     NDSolve[ {y''[x]  -x y[x], y[0]  a, y'[0] == b},
      y, {x, 0, 4}]]], {t, 0, 4},
  Epilog -> {Point[{4, 1/2}], Green, Arrow[{{0, a}, {1, b + a}}], Red,
     Point[{0, a}]}, ImagePadding -> 25, PlotRange -> {{0,4.5}, 2{-3,3}}],
 {{a, 1}, -3, 3, 0.5},
 {{b, 0}, -3, 3, 0.5}, ContinuousAction->True
]
Animate
Animate%5B%0A%20%20ParametricPlot%5BReIm%20%40%20Exp%5B-I%20%28%5C%5BPhi%5D%20%2B%20%5C%5BGamma%5D%20I%20%5C%5BPhi%5D%29%5D%2C%20%7B%5C%5BPhi%5D%2C0%2C5Pi%7D%2C%20%0A%20%20%20%20PlotLabel-%3EStringTemplate%5B%22%5C%5BGamma%5D%20%3D%20%60%60%22%5D%5B%5C%5BGamma%5D%5D%0A%20%20%5D%0A%2C%20%7B%5C%5BGamma%5D%2C0%2C0.5%7D%5D Plot expression with epilog
Animate[Plot[1.0 + Sin[w] Sin[x + w],{x,0,5Pi}, Epilog->{
  Red, Point[{8.0, 1.0 + Sin[w] Sin[8.0 + w]}]
}], {w,0,Pi}]
In any case, please, consider to use ManipulatePlot or general low-level building blocks like Offload and etc for more complex cases.
Images are also supported:
img = ImageResize[ExampleData[{"TestImage","Apples"}], 500];
Manipulate[ImageAdjust[img, i], {i,-1,1,0.3}, ContinuousAction->True]
Improved Shell Cells
We switched to StartProcess for shell-like cells:
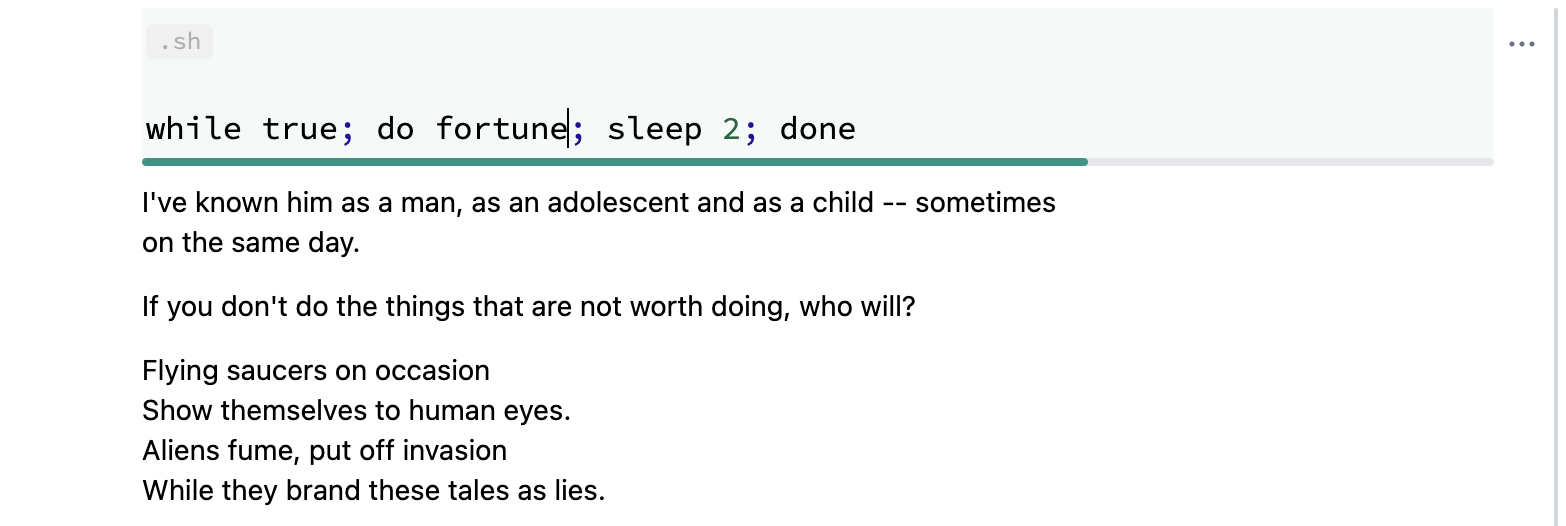
It allows running something continuously without blocking the kernel. To interrupt the process - simply abort the evaluation as usual.
Improved Labels for Graphics
We fixed a couple of bugs related to label positioning and font rendering. Here is an example:
ListPlot[MapThread[Labeled, {{{1,2},{2,4},{4,6}}, {"1","2","3"}}]] (*VB[*)(FrontEndRef["2c568e52-2973-432d-a871-f6e70ccd1dfc"])(*,*)(*"1:eJxTTMoPSmNkYGAoZgESHvk5KRCeEJBwK8rPK3HNS3GtSE0uLUlMykkNVgEKGyWbmlmkmhrpGlmaG+uaGBul6CZamBvqppmlmhskJ6cYpqQlAwB39xWq"*)(*]VB*) and for Offset, you can specify the displacement of labels or set an absolute size for Disk, Circle and others:
Plot[x, {x,0,1}, Epilog->{Disk[{.5, .5}, Offset[{15,15}]]}] (*VB[*)(FrontEndRef["025c6102-b371-4910-b09d-6d8567edb4d5"])(*,*)(*"1:eJxTTMoPSmNkYGAoZgESHvk5KRCeEJBwK8rPK3HNS3GtSE0uLUlMykkNVgEKGxiZJpsZGhjpJhmbG+qaWBoa6CYZWKbomqVYmJqZp6YkmaSYAgBv4hUM"*)(*]VB*) Improved PlotLabel for Graphics3D
We have enhanced the PlotLabel option in Graphics3D functions to support more flexible labeling - not only text:
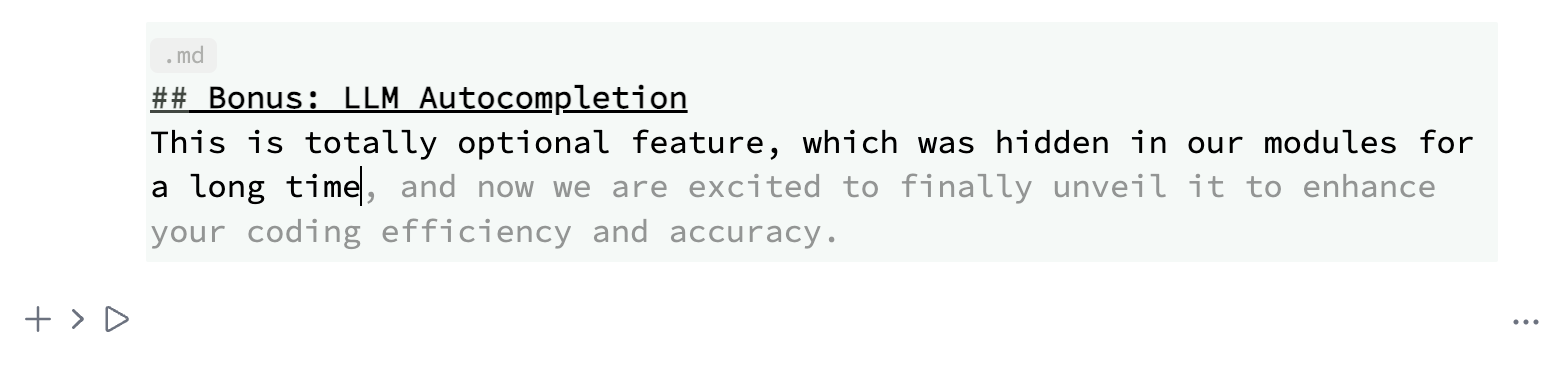
SphericalPlot3D[1, {\[Theta], 0, Pi}, {\[Phi], 0, 2Pi}, PlotLabel->HoldForm[(*SbB[*)Subscript[Y(*|*),(*|*)0,0](*]SbB*)]] (*VB[*)(FrontEndRef["2be2fdb8-5dee-493a-b6a2-f362fb470b08"])(*,*)(*"1:eJxTTMoPSmNkYGAoZgESHvk5KRCeEJBwK8rPK3HNS3GtSE0uLUlMykkNVgEKGyWlGqWlJFnomqakpuqaWBon6iaZJRrpphmbGaUlmZgbJBlYAACW2RYv"*)(*]VB*) Bonus: LLM Autocompletion
This is totally optional feature, which was hidden in our modules for a long time.

In general it works on all kind of languages, including English 🙂
By the default it uses the same endpoint as assistant chat window, i.e. OpenAPI API.
To enable LLM autocompletion find a checkbox in the Settings menu under the "AI Assistant" section.
And do not forget to set API Key in the designated field to authenticate your requests.